| GINO Graphics Suite - GINOGRAF v9.5 |  |
 |
| GINO Graphics Suite - GINOGRAF v9.5 | |
|
There are four components available for the building of a fully annotated, filled Histogram:
| ggBlockFillHistogram() | Drawing block filled columns |
| ggAddHistogramOutline() | Drawing column outline |
| ggFillHistogram() | Drawing filled columns |
| ggAddHistogramValues() | Displaying height values |
All four routines may be used independently of each other or on the same chart although it is usual to use a combination of block filling and values, or simple filling, outline and values. It is necessary to define both X and Y axis positions and data ranges before calling any of these routines either by the axis definition routines or the Complete Chart Drawing routine ggPlotHistogram(). One of the axes should be defined as a discrete axis (scale=GDISCRETE) whereupon the heights are measured against the remaining non-discrete axis.
Users should note that if ggFillHistogram() is called after ggPlotHistogram() or ggAddHistogramOutline() the Histogram outline will be overwritten by the filling. If the outline is required, the solution is to always draw the outline with ggAddHistogramOutline() after the filling. The block filling routine fills the appropriate areas and follows this with drawing the histogram outline in the current GINO line colour.
The routine to display a block filled histogram is:
ggBlockFillHistogram(ncols,yarray,frac,line)This routine displays a set of data values as block filled columns on the last defined set of axes. The columns are plotted about the centre of the tick marks along the discrete axis according to the current block chart attributes. All the columns are solid filled with the specified line style with the extrusions filled with a darker (or lighter) shade of this line style again according to the current block chart attributes (using ggSetBlockChartAttribs()).
The following shows an example of a block filled histogram.
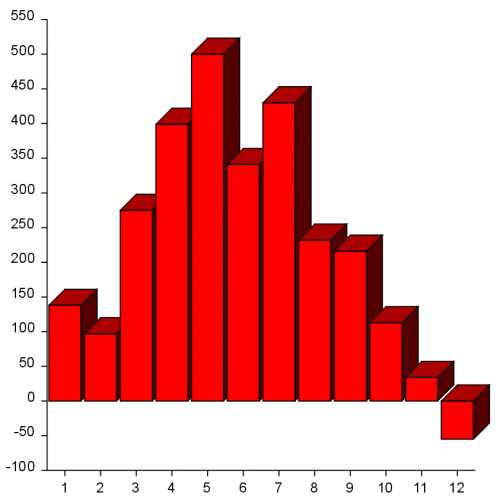 |
Block Filled Histogram |
The routine to display a set of columns is:
ggAddHistogramOutline(ncols,yarray,frac)This routine displays a set of data values as columns on the last defined set of axes. The columns are plotted about the centre of the tick marks along the discrete axis in the order that they are presented within the array.
The representation of the columns depends on the width of the columns which is determined using the parameter frac, the fraction of the widest possible column given the axis length and number of columns.
The effects of changing frac within ggAddHistogramOutline() are shown below:
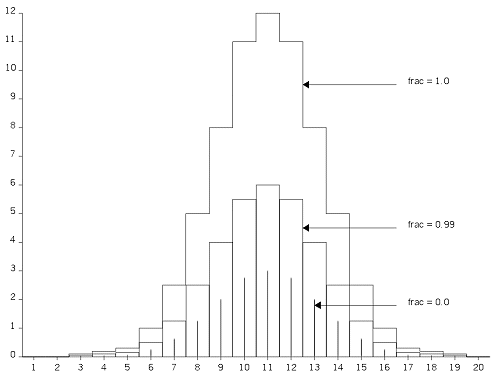 |
Effect of frac |
If a height defined in array yarray is negative, the column is drawn on the negative side of the discrete axis.
The routine to display a set of filled columns is:
ggFillHistogram(ncols,yarray,frac,fill,line)This routine displays a set of data values as filled columns on the last defined set of axes. The columns are plotted about the centre of the tick marks along the discrete axis in the order that they are presented within the array.
The width of the columns is determined using the parameter frac, the fraction of the widest possible column given the axis length and number of columns.
The hatch or fill style for each column is held in the array fill. Various hatches and cross hatches as well as solid fill are available. If an element of fill contains a number less than -1(GHOLLOW), the corresponding column is not filled and the boundary not drawn. The line styles used to fill the columns are held in the array line. The default line styles, hatch styles and fill styles appear in Appendix A of this manual (see Defaults). Further information on line style definition (which includes colour definition) and information on hatch and fill style definition appears in the main introduction.
If a height defined in array yarray is negative, the column is filled on the negative side of the discrete axis.
The column outlines are not drawn with this routine. Users should use ggPlotHistogram() or ggAddHistogramOutline() to draw the outline.
The routine to output Histogram height values is:
ggAddHistogramValues(ncols,yarray,frac)where ggAddHistogramValues() will display ncols values in the array yarray associated with the Histogram columns drawn by ggPlotHistogram() or ggAddHistogramOutline(). The argument frac is required to ensure correct positioning of the values when they are placed at the edge of each column as shown below, it should therefore be set to the same value as that used in a corresponding call to ggPlotHistogram() or ggAddHistogramOutline(). By default, the values are positioned at the centre of the associated column in the same numerical format as the current non-discrete axes. The numerical format of the data values can be changed through the routine ggSetAxesAnnotation() with xory set to which ever is the non-discrete axis.
The position and orientation of each value can be changed with the routine:
ggSetValueAttribs(xpos,ypos,xory,xoff,yoff,angstr,justmb,juslcr)where xpos, ypos and xory determine the position of each values control point, about which the remaining arguments refer. The control point can be positioned at one of 15 positions around each column as well as 3 positions at a specified X or Y coordinate by setting yorx and either xpos or ypos to GSPECIFIED. The value of xory is measured in graphical coordinates and so refers to the current axes ranges (as set up by ggSetAxesScaling()) for the appropriate axis.
The control points are shown below with height values drawn centrally over each one and xory set to 9.0.
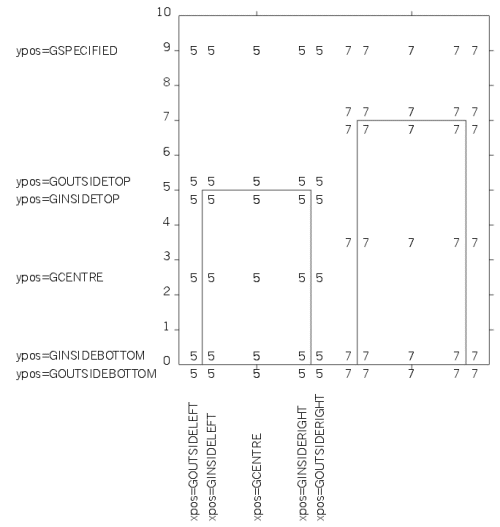 |
Annotation control positions |
The routine ggSetValueAttribs() can also be used to set an additional offset (measured in user space coordinates) in the horizontal and/or vertical direction (xoff,yoff), an annotation string angle (angstr) and a vertical and/or horizontal justification (justmb,jushor). The default setting of centre justification is sufficient for centrally placed control positions (xpos = GCENTRE), but the appropriate left or right justification would usually be required for control positions set at the edges of the column limits.
Where Histogram data values are negative, the position of the control point on the non-discrete axis is placed in the matching position corresponding to the column height but below the zero axis.
Appended to each value in any of the value charts can be added a prefix and/or suffix string using the routine.
ggSetValueTags(prefix,suffix)where prefix and suffix are strings of up to 30 characters that are appended to all the values in one value chart output. The prefix and/or suffix strings are included as part of the value when calculating the justified position of the total output.
The following example shows the use of all the Histogram component routines:
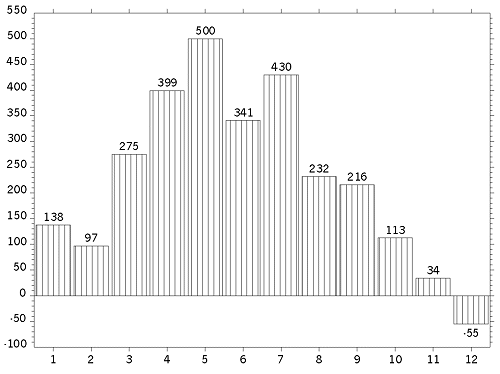 |
Fully annotated Histogram |
[C/C++]
/*  FULLY ANNOTATED HISTOGRAM */
#include <gino-c.h>
#include <graf-c.h>

int main(void) {
   float yarray[12] = {138.0,97.0,275.0,399.0,
       500.0,341.0,430.0,232.0,216.0,113.0,34.0,-55.0};
   GCHASTY rep;
   GLIMIT lims;
   int i, flg, fill[12], line[12];
   for (i=0; i<12; i++) {
       fill[i]=2;
       line[i]=1;
   }

   gOpenGino();
   xxxxx();
   ggSetGraphCharMode(GGINOMODE);
/* ENQUIRE GINOGRAF DRAWING LIMITS AND CHARACTER SIZE */
   ggEnqPlotFrame(&flg,&lims);
   gEnqCharAttribs(&rep);

/* SET UP AXES POSITIONS AND SCALES */
   ggSetAxesPos(GAXISSTART,9.0*rep.width,
       5.0*rep.height,lims.xmax-lims.xmin-12.0*rep.width,GXAXIS);
   ggSetAxesScaling(GDISCRETE,12,1.0,12.0,GXAXIS);
   ggSetAxesPos(GAXISSTART,9.0*rep.width,
       5.0*rep.height,lims.ymax-lims.ymin-10.*rep.height,GYAXIS);
   ggSetAxesScaling(GLINEARTYPE1,12,-100.0,550.0,GYAXIS);

/* DRAW HISTOGRAM */
   ggFillHistogram(12,yarray,0.9,fill,line);
   ggAddHistogramOutline(12,yarray,0.9);

/* POSITION HEIGHT VALUES ABOVE COLUMNS */
   ggSetValueAttribs(GCENTRE,GOUTSIDETOP,0.0,
       0.0,0.0,0.0,GCENTRE,GCENTRE);
   ggAddHistogramValues(12,yarray,0.9);

/* DRAW GRID */
   ggAddGrid(GINTERMEDIATE,GTICKS,GANNOTATION,GANNOTATION);

   gSuspendDevice();
   gCloseGino();
   return(0);
}
[F90]
! FULLY ANNOTATED HISTOGRAM
use gino_f90
use graf_f90

  real, dimension(12) :: yarray = (/138.0,97.0,275.0, &
    399.0,500.0,341.0,430.0,232.0,216.0,113.0,34.0,-55.0/)
  type (GCHASTY) rep
  type (GLIMIT) lims
  integer flg
  integer, dimension(12) :: fill=(/12*2/)
  integer, dimension(12) :: line=(/12*1/)

  call gOpenGino
  call xxxxx
  call ggSetGraphCharMode(GGINOMODE)
! ENQUIRE GINOGRAF DRAWING LIMITS AND CHARACTER SIZE
  call ggEnqPlotFrame(flg,lims)
  call gEnqCharAttribs(rep)

! SET UP AXES POSITIONS AND SCALES
  call ggSetAxesPos(GAXISSTART,9.0*rep%%width, &
       5.0*rep%height,lims%xmax-lims%xmin-12.0*rep%width,GXAXIS)
  call ggSetAxesScaling(GDISCRETE,12,1.0,12.0,GXAXIS)
  call ggSetAxesPos(GAXISSTART,9.0*rep%width, &
       5.0*rep%height,lims%ymax-lims%ymin-10.*rep%height,GYAXIS)
  call ggSetAxesScaling(GLINEARTYPE1,12,-100.0,550.0,GYAXIS)

! DRAW HISTOGRAM
  call ggFillHistogram(12,yarray,0.9,fill,line)
  call ggAddHistogramOutline(12,yarray,0.9)

! POSITION HEIGHT VALUES ABOVE COLUMNS
  call ggSetValueAttribs(GCENTRE,GOUTSIDETOP,0.0, &
    0.0,0.0,0.0,GCENTRE,GCENTRE)
  call ggAddHistogramValues(12,yarray,0.9)

! DRAW GRID
  call ggAddGrid(GINTERMEDIATE,GTICKS,GANNOTATION,GANNOTATION)

  call gSuspendDevice
  call gCloseGino
  stop
  end